01 Data-Driven Mindset: The Core Key to Advancing on Rednote
As a social e-commerce platform centered around “content-driven interest provoking & recommendation”, Rednote’s operational essence lies in achieving precise connections between content and users through its tag-matching mechanism. The platform’s algorithm distributes traffic by identifying both static tags (such as titles and keywords in the body text) and dynamic tags (real-time user interaction behaviors) of notes. To achieve effective growth on the platform, granular operational analytics serve as the core driving force.
The Three Core Values of a Data-Driven Mindset
1. Move Beyond Guesswork, Let Data Guide You
Many creators rely on intuition, leaving them confused about why some content goes viral while other pieces flop. Data analysis helps identify patterns and eliminates copycat anxiety.
2. Precise Targeting, Eliminate Vague Strategies
Data reveals what resonates with your audience and what doesn’t. For instance, an “average view duration” below 10 seconds signals a weak hook, while a low “follower conversion rate” often points to an unclear creator persona.
3. A Repeatable Formula for Viral Content
Once you understand the data patterns, viral success can be systematically replicated. For example, analysis may show that prompting discussions in the comments can boost “completion rates” by over 20%, and using engaging “conversation hooks” can reliably increase interactions.
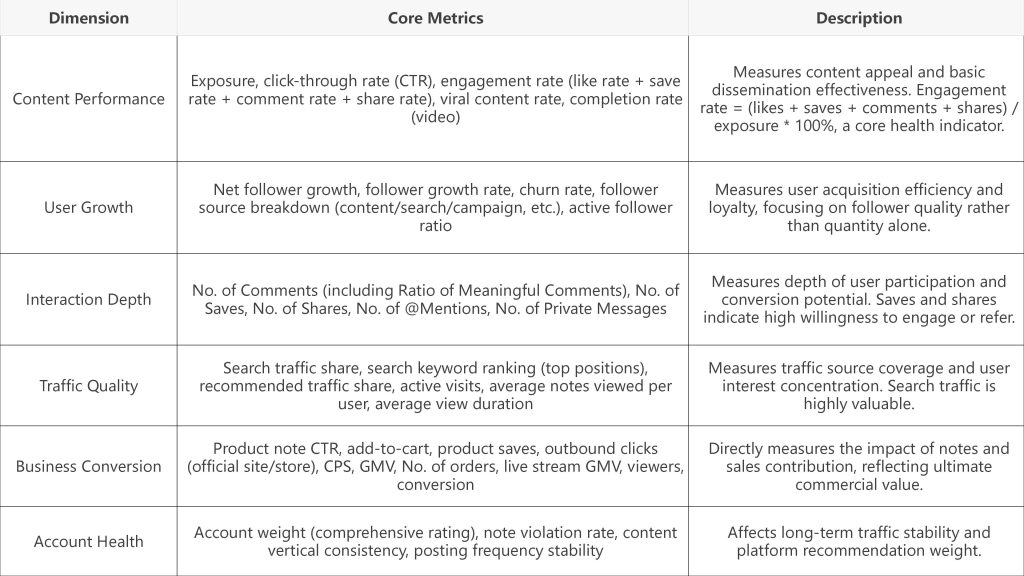
02 Core Analysis Dimensions and Metrics
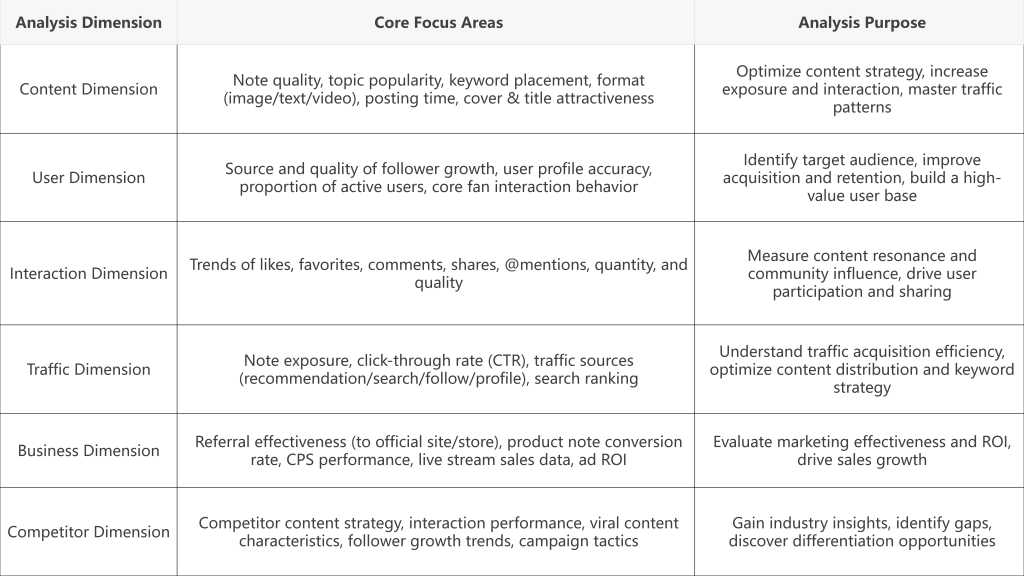
1. Six Key Analysis Dimensions
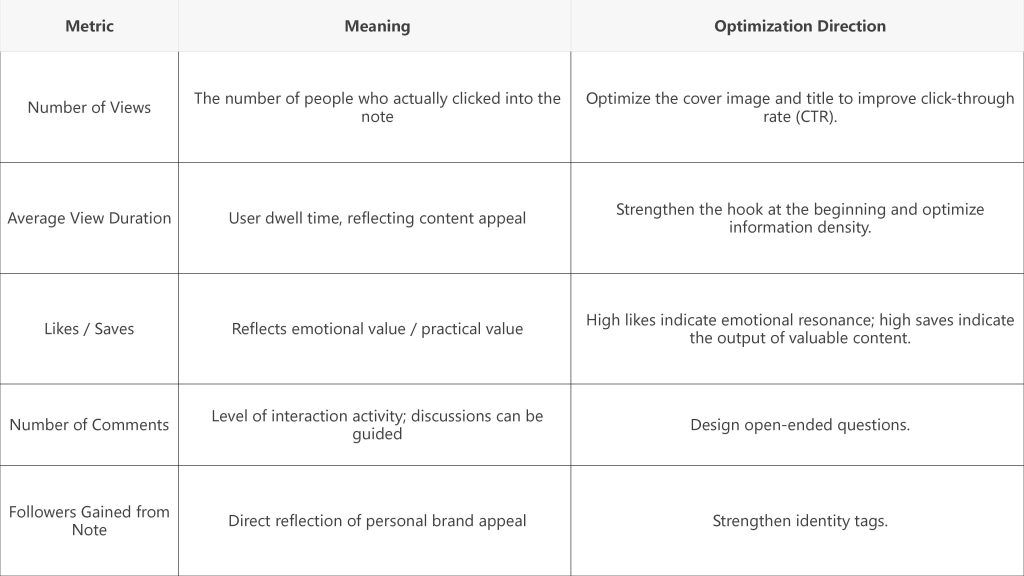
2. Key Analysis Metrics

03 Single-Note Data Analysis: 8 Metrics to Thoroughly Understand Content Quality
1. Core Metrics Interpretation

2.The CES Algorithm: Rednote’s Invisible Distribution Logic
While not officially acknowledged by the platform, the widely referenced CES algorithm (like: 1 point + save: 1 point + comment: 4 points + follow: 8 points) can help understand Rednote’s content distribution mechanism.
04 Overall Account Analysis: Interpreting Operational Trends from Macro Data
Three Key Dimensions of the Creator Weekly Report
1. Traffic Source Composition
Homepage Recommendation >80%: Indicates that the content aligns with the platform’s distribution logic. Maintain the current style.
Increasing Share of Search Traffic: Signifies successful keyword strategy. Can intensify SEO efforts.
2. Follower Demographics
Pay attention to the distribution of age, gender, and location to adjust content direction. For example, a parenting blogger finding that 70% of their followers are “mothers in second-tier cities” could focus more on recommending cost-effective baby and maternal products.
3. Posting Activity
Maintain a frequency of 3-5 posts per week. Interrupting regular updates will negatively impact your account’s ranking weight.
05 Competitor Data Analysis: Choosing Your Niche by Standing on the Shoulders of Giants
1. Tool Recommendations and Usage Tips
Xinhong/Huitun Data: Spend 60-100 RMB per month to purchase a membership, which allows access to competitor pricing, viral notes, live stream data, and more.
Pugongying Platform: Log in as a merchant to review competitors’ advertising frequency and product categories, assessing the commercial potential of a niche.
2. Three Criteria for Selecting Benchmark Accounts
- Similar Follower Count: Choose competitors with the same or similar follower scale for more relevant data insights.
- Stable Update Frequency: Opt for accounts that post at least twice weekly to avoid referencing inactive accounts.
- Clear Monetization Model: Prioritize accounts that combine both sponsored content and product sales to learn diversified revenue strategies.
06 Data Analysis Methods
1. Comparative Analysis
Horizontal Comparison: Compare your data with that of competitor accounts during the same period (e.g. engagement rate, follower growth speed), and evaluate the performance of different notes/campaigns/creators.
Vertical Comparison: Compare your account’s data across different time periods (e.g., month-over-month, year-over-year), and analyze performance before and after campaigns.
2. Trend Analysis
- Track changes in core metrics (e.g., follower count, engagement rate, search traffic) over time to identify growth opportunities or abnormal fluctuations.
- Analyze periodic or sudden trends in content topic popularity and keyword search volume.
3. Funnel Analysis
Deconstruct the key steps from “users seeing the note” to “conversion” (Exposure -> Click -> Read/Watch -> Interaction -> Product/Link Click -> Add to Cart/Inquiry -> Purchase). Analyze the conversion rate at each stage to identify bottlenecks and drop-off points.
4. Attribution Analysis
Identify the main factors driving key outcomes (e.g., follower growth, conversions). Was it a specific viral note? A campaign? Or consistent high-quality content output?
5. User Segmentation Analysis
- Segment followers based on behavioral data (activity level, interaction depth, purchasing power) into groups such as core fans, active fans, casual followers, and potential interest fans.
- Develop tailored operational strategies for different user segments (e.g., retaining core fans, incentivizing active fans, converting casual followers).
6. Content Clustering & Text Analysis
- Perform text mining on comments and note content to extract high-frequency keywords, sentimenttendency(positive/negative), user concerns, pain points, and needs.
- Identify common characteristics of viral content (theme, structure, keywords, visual style).
7. A/B Testing
Conduct small-scale tests on key variables (e.g., different cover images, title copy, posting times, campaign formats, call-to-action wording) and select the optimal approach based on data results.
07 Key Considerations for Analytical Practice
Define Objectives and Align Metrics: Before analysis, clearly define the core business objective (e.g., increasing brand awareness? growing followers? driving sales?) and select the most relevant metrics accordingly.
Combine Qualitative Analysis: Qualitative insights from user comments, private message feedback, industry reports, and competitor cases can provide deeper context and understanding, complementing purely quantitative data.
Focus on Metric Correlation: Isolated metrics offer limited value. Pay attention to relationships between indicators (e.g., high exposure but low interaction may indicate insufficient content appeal; high interaction but low conversion may suggest flaws in the conversion funnel).
Long-Term Tracking and Dynamic Adjustment: Operational analysis is an ongoing process. Establish regular review mechanisms and adjust strategies promptly based on data feedback. Platform algorithms and user preferences also change over time.
Leverage Platform Tools Effectively: Make full use of Rednote’s professional backend analytics (note performance, follower data, interaction metrics, referral data), Potato Chip (Shutiao) feed ad campaign data, and third-party data platforms to gain multidimensional insights.
Data Compliance and Privacy: Strictly adhere to platform data usage policies, relevant laws and regulations regarding user privacy protection.
Through systematic data analysis and optimization, combined with an understanding of platform dynamics and user needs, it is possible to achieve breakthrough growth from zero to one on Rednote, ultimately creating viral content and a personal brand that consistently generate value.

